
High Frequency Weld Process Robustness Testing
- United Technical

- Sep 15, 2021
- 2 min read
Updated: Apr 27, 2022
Introduction:
High Frequency Induction Welding (HFIW) is commonly used to weld the opposing edges of a rollformed tube to produce tubular products (one form of electric resistance welded (ERW) tube) as shown in Figure 1. This process belongs to the forge welding class of resistance welding processes. The HFIW process (and other variations) is commonly used to produce a round tube which can be subsequently shaped by passing the tube through a set of dies that produces the desired shape. The primary variables in this process include mill speed; weld power and frequency (depth of current penetration into the sheet); induction coil position relative to the forging location, strip width, number of coil turns; forging force; etc. HFIW is generally very reliable. However, while troubleshooting a relatively new mill, weld quality variability can be an issue. This was the case in the application described below. Troubleshooting the tube required a knowledge of forge welding principles and HFIW process physics knowledge. This information can be found in the welding handbooks.

Figure 1 – Schematic Diagram of the High Frequency Induction Welding Process for Making ERW Tube
After initial discussions and investigation of the issues and welding equipment, it became apparent to assess an unbiased comparison of the present weld quality and determine what would be needed to achieve the desired conditions. A power lobe investigation was suggested. This is analogous to a weld lobe in resistance spot welding. Samples are destructively tested to determine the quality limit at the lower power conditions while the upper limit was determined by observation and spot checks of the weld quality. The weld quality and observations are made relative to the HFIW weld process requirements set out by the company quality plan.
HF Weld Power Lobe Data:
The weld power lobe data is shown in Table 1 and Figure 2. The approach was to assess the weld quality at two speeds representing normal production (settings of “1.0” in Figure 2) and a slower speed - sometime used for assessing weld quality during setup. Destructive testing of each weld condition was used to assess weld HFIW seam quality. The standard operating conditions looked good during the welding process so this was designated as “1.0” in the data. This observation was confirmed by the operator. The upper and lower limits as highlighted in Table 1 were based on mechanical testing (lower limit) and feedback from the operator regarding excessive heating conditions (upper limit).
The test increments used were split into uniform changes over the power range anticipated.
Table 1 - Weld power Lobe Data Expressed as Percentages of the Operating Conditions (Settings of “1.0”)
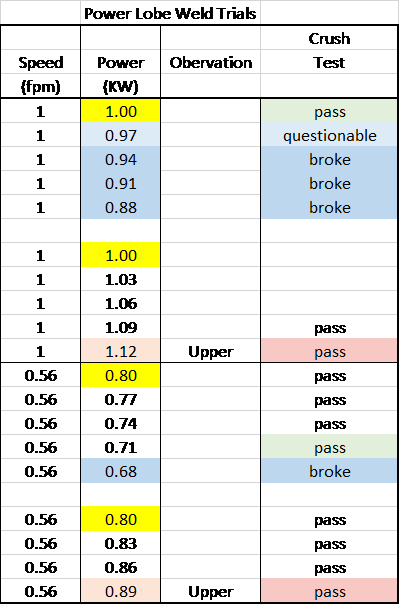

Figure 2 - Weld Power Lobe Graph Expressed as Percentages of the Operating Conditions (Settings of “1.0”)
The power lobe graph pictorially shows the effect of weld speed on process robustness. At the slow speed, the operating conditions are at the center of the power range; while at faster speeds, the operating conditions may be limited by mechanical test failure. This suggests that the operating conditions need to be widened or the power level effectively increased towards the center of the power lobe at the higher speed. Changes were made to improve the process capability at faster speeds and the issue was resolved. It was necessary, in this instance, to measure the problem in order to resolve it.


Comments